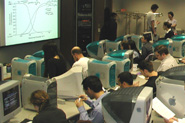
Feinberg School Welcomes MD Class of 2007
 This week the Feinberg School welcomes the 170 medical students of the Class of 2007. Orientation Week is filled with introductory sessions about the school, professionalism in medicine, and the curriculum as well as myriad social events. These include tours of Chicago, visits to its renowned museums, and the perennial favorite with incoming students—dinners hosted by deans and faculty members. The first class, Medical Decision Making I, begins Friday morning, followed by a Q&A with school deans and the Founders’ Day Convocation, which officially opens the academic year.
J. Larry Jameson, MD, PhD, Irving S. Cutter Professor and chair of medicine, will speak on “Pathways in Medicine: How to Find Your Career Niche” during the convocation that begins at 2:30 p.m. Friday, August 29, in Thorne Auditorium on the Chicago campus. Dean Lewis Landsberg, MD, will welcome the entering students, introduce faculty members, and announce teaching awards. Student Senate President Benjamin Levi of Highland Park, Illinois, will present the students’ Oath of Professional Conduct and lead the White Coat Ceremony, in which new students receive white coats from second-year students.
This fall’s incoming class in the MD program includes students from 30 states and 11 foreign countries. They range in age from 20 to 33, with 23 being the average. These bright students garnered average MCAT scores of 10.4 in verbal reasoning, 10.8 in physical sciences, and 11 in biological sciences. The class is nearly evenly split among men (84) and women (86), who bring a variety of experiences and backgrounds. They include a Rhodes scholar, a Fullbright scholar, a NASA space scholar, two National Science Foundation award recipients, two National Institutes of Health research fellows, Peace Corps and AmeriCorps volunteers, teachers, emergency medical technicians, musicians, and more.
Of those providing information, 75 students (44.11 percent) are white, 53 (31.17 percent) Asian, 19 (11.17 percent) African American, 7 (4.12 percent) Hispanic, and 3 (1.76 percent) Native American or Native Hawaiian.


